A series of studies is conducted [1-5] in order to evaluate the performance of existing objective quality metrics and to propose new quality assessment methodologies. For this purpose, a representative set of geometry-only point clouds is assembled and degraded using two different types of distortions.
In this webpage, we make publicly available a dataset consisting of reference point clouds, degraded stimuli, degradation levels, and subjective quality scores that were obtained under two experimental setups; that is, one carried in a desktop setup [1] and a second performed in Augmented Reality (AR) using a head-mounted display (HMD) [2]. In the former setup, different test methods were used in separate sessions.
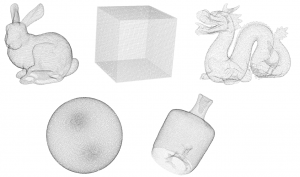
Reference models of the dataset
Contents
Bunny and dragon are selected from the Stanford 3D Scanning Repository to represent contents with regular geometry and reduced amount of noise. Cube and sphere are artificially generated using mathematical formulas and represent synthetic contents with highly regular geometry. Finally, vase, is a 3D content manually captured using the Intel RealSense R200 camera, and constitutes a representative point cloud with irregular structure that can be acquired by low-cost depth sensors. To form a representative dataset, the contents are selected considering the following properties:
- Simplicity, as it would have been difficult for subjects to clearly perceive a complex scene in the absence of texture. Although simple, the complexity of the contents covers a reasonable range.
- Diversity of geometric structure, as different artifacts may be observed by applying different types of degradations. Thus, the point clouds are generated by different means.
- Similarity of points density, as the visual quality of point clouds is directly affected by the number of points used to represent an object.
To regularize the impact of the distortions, the contents are scaled to fit in a bounding box of size 1.
Types of degradation
Two types of degradations are employed and evaluated in separate subjective experiments:
- Octree-pruning is used to simulate compression distortions. It is obtained by setting a desirable Level of Detail (LoD) in the octree structure that encloses the content. The LoD is set appropriately for each content to achieve target percentages of remaining points (ρ), allowing an acceptable deviation of ±2% (ρ = {90%, 70%, 50%, 30%}).
- Gaussian noise is used to simulate position errors. The coordinates of every point of the content are modified across X, Y and Z axis, following a target standard deviation (σ = {0.0005, 0.002, 0.008, 0.016}) to account for different levels of noise.
Download
In the provided URL link you can find the dataset.
stimuli
In this folder, you can find the stimuli under evaluation used in the studies [1-5], clustered per degradation type. The stimuli are stored in PLY format using ASCII encoding. The following naming convention is adopted:
- contentName = {bunny, cube, dragon, sphere, vase},
- degradationType = {D01, D02}, with D01 indicating Octree-pruning and D02 indicating Gaussian noise,
- degradationLevel = {L01, L02, L03, L04}, with increasing numbers indicating higher levels of degradations. For instance, L01 and L04 for D01 correspond to 90% and 30% of remaining points, respectively. L01 and L04 for D02 correspond to 0.005 and 0.016 standard deviation, respectively.
The reference contents are noted as: contentName.ply, while the distorted stimuli are noted as: contentName_degradationType_degradationLevel.ply.
subjective scores
In this folder, you can find .csv files with subjective quality scores for the stimuli under evaluation, clustered per experimental setup; that is, ‘desktop setup’ [1], and ‘hmd ar setup’ [2]. Note that ratings for the reference contents are also provided, since they served as hidden references in the subjective experiments.
desktop setup
In this sub-folder, you can find the scores collected from subjective evaluations in a desktop setup that were conducted in the framework of [1], clustered per degradation type. For each degradation type, two test methods, namely ACR and DSIS, are adopted in separate sessions. The sets of scores can be distinguished by the corresponding suffix in the provided .csv files. Note that the same sets of scores are also used in [3-5].
hmd ar setup
In this sub-folder, you can find the scores collected from the subjective evaluations in AR using an HMD that were conducted in the framework of [2], clustered per degradation type. For each degradation type, the DSIS test method is adopted. Note that the same set of scores is also used in [3].
degradation levels
In this folder, you can find .csv files that correspond to the degradation types of the stimuli used in the studies [1-5]. The number of input and output points are provided together with the degradation level per stimulus.
Conditions of use
- If you wish to use the provided ‘stimuli’, or the subjective scores from the ‘desktop setup’ in your research, we kindly ask you to cite [1].
- If you wish to use the subjective scores from the ‘hmd ar setup’ in your research, we kindly ask you to cite [2].
References
- E. Alexiou and T. Ebrahimi, “On the performance of metrics to predict quality in point cloud representations,” Proc. SPIE 10396, Applications of Digital Image Processing XL, 103961H (19 September 2017). doi: 10.1117/12.2275142
- E. Alexiou, E. Upenik and T. Ebrahimi, “Towards subjective quality assessment of point cloud imaging in augmented reality,” 2017 IEEE 19th International Workshop on Multimedia Signal Processing (MMSP), Luton, 2017, pp. 1-6. doi: 10.1109/MMSP.2017.8122237
- E. Alexiou and T. Ebrahimi, “Impact of Visualisation Strategy for Subjective Quality Assessment of Point Clouds,” 2018 IEEE International Conference on Multimedia & Expo Workshops (ICMEW), San Diego, CA, 2018, pp. 1-6. doi: 10.1109/ICMEW.2018.8551498
- E. Alexiou and T. Ebrahimi, “Benchmarking of Objective Quality Metrics for Colorless Point Clouds,” 2018 Picture Coding Symposium (PCS), San Francisco, CA, 2018, pp. 51-55. doi: 10.1109/PCS.2018.8456252
- E. Alexiou and T. Ebrahimi, “Point Cloud Quality Assessment Metric Based on Angular Similarity,” 2018 IEEE International Conference on Multimedia and Expo (ICME), San Diego, CA, 2018, pp. 1-6. doi: 10.1109/ICME.2018.8486512